Suitable For
- 快速建立監控系統
- Prometheus, Blackbox Exporter, Alertmanager 簡單概念
- Prometheus, Blackbox Exporter, Alertmanager 的設定
- 結合 Slack 通知
Concepts
Prometheus Architecture Overview[1]
先上 Prometheus 的架構圖[2] ( 來源 Prometheus Github[2] )

本次主要使用到的部分有 Prometheus, Blackbox Exporter, Alertmanager
主要的功能如下:
- Prometheus: 監控系統
- Blackbox Exporter: 以 Blackbox 的方式,監控外部服務,此次主要用來監控網站是否存活
- Alertmanager: 通知系統接受 Prometheus 的警告訊息,並進行通知,可以透過 Slack, Email 等方式通知
Evnironment
- 支援 docker, docker compose 的主機 ( 例如 Ubuntu 22.04.2 )
- 欲監控的網站 ( 例如 fskuan.com )
- Slack 帳號
Procedure
-
Docker Compose File 如下,相關的設定檔同步放在 Github 上
1 2 3 4 5 6 7 8 9 10 11 12 13 14 15 16 17 18 19 20 21 22 23 24 25 26 27 28 29 30 31 32 33 34 35 36 37 38 39 40version: '3.7' services: prometheus: image: prom/prometheus:main volumes: - ./config/prometheus.yml:/etc/prometheus/prometheus.yml - ./config/alerts.yml:/etc/prometheus/alerts.yml networks: - monitoring_network ports: - "9090:9090" command: - "--config.file=/etc/prometheus/prometheus.yml" - "--web.enable-lifecycle" blackbox_exporter: image: prom/blackbox-exporter:master volumes: - ./config/blackbox.yml:/etc/blackbox_exporter/config.yml networks: - monitoring_network ports: - "9115:9115" alertmanager: image: prom/alertmanager:main volumes: - ./config/alertmanager.yml:/etc/alertmanager/alertmanager.yml networks: - monitoring_network ports: - "9093:9093" networks: monitoring_network: driver: bridge ipam: config: - subnet: 172.28.0.0/16Docker Compose 中只有簡單的 image, volumes, networks, ports 的設定,不多做贅述
-
其他的設定都放在 config 資料夾底下,先介紹 Blackbox Exporter 的設定檔 ( blackbox.yml )
1
2
3
4
5
6
7
modules: http_2xx_ip4: # 新增一個監控的模組 prober: http # 使用 http 的方式監控 timeout: 10s # 超時時間 http: # http 的設定 preferred_ip_protocol: "ip4" # 使用 IPv4 method: GET # 使用 GET 方法Blackbox 會優先使用 IPv6,由於我的環境中一律使用 IPv4,所以特別指定使用 IPv4,以避免無法正確監控的問題
具體說明可以參考此 Blog
-
接下來設定 Prometheus Config
1 2 3 4 5 6 7 8 9 10 11 12 13 14 15 16 17 18 19 20 21 22 23 24 25 26 27 28 29 30 31 32 33global: scrape_interval: 20s # 全域設定抓取間隔,每20秒抓取一次監控數據 alerting: alertmanagers: - static_configs: - targets: - "alertmanager:9093" # 指定 Alertmanager 的地址,Prometheus 將警報發送到這個地址 rule_files: - "alerts.yml" # 指定警報規則文件,Prometheus 會根據這里定義的規則生成警報 scrape_configs: - job_name: 'prometheus' static_configs: - targets: ['localhost:9090'] - job_name: 'blackbox' # 設定 blackbox 任務 metrics_path: /probe params: module: [http_2xx_ip4] # 使用剛才客製化的模組 static_configs: - targets: # 設定要監控的網站列表 - https://fskuan.com - https://example1.fskuan.com - https://example2.fskuan.com/swagger/index.html relabel_configs: # 使用重標簽配置來修改監控目標的標簽和地址 - source_labels: [__address__] target_label: __param_target # 將目標地址設置為 '__param_target' 參數,供 Blackbox Exporter 使用 - source_labels: [__param_target] target_label: instance # 將 '__param_target' 參數的值覆制到 'instance' 標簽,用於標識實例 - target_label: __address__ replacement: blackbox_exporter:9115 # 將 '__address__' 標簽的值替換為 Blackbox Exporter 的地址,這樣 Prometheus 就會抓取 Blackbox Exporter 提供的監控數據 -
設定警報規則 ( alert.yml )
 1
 2
 3
 4
 5
 6
 7
 8
 9
10
11
groups: - name: 'WebService' rules: - alert: WebSiteDown expr: probe_success{job="blackbox"} == 0 # probe sucess = 0 意思是目標網站抓取失敗 for: 1m # 持續失敗 1 分鐘 labels: severity: critical annotations: # 設定的訊息內容,會顯示在對應的通知中,例如 Slack summary: "Web site down (instance {{ $labels.instance }})" description: "The web site {{ $labels.instance }} has been down for more than 1 minute." -
設定警報管理規則 ( alertmanager.yml )
 1
 2
 3
 4
 5
 6
 7
 8
 9
10
11
12
13
14
15
16
17
18
19
global: resolve_timeout: 5m route: group_by: ['alertname'] group_wait: 10s group_interval: 10s repeat_interval: 10m receiver: 'slack' receivers: - name: 'slack' slack_configs: - api_url: '{your_slack_api_url_here}' # 設定 Slack 應用程式 API channel: '#monitoring' text: "{{ range .Alerts }} {{ .Annotations.description}}\n {{end}} {{ .CommonAnnotations.username}} <{{.CommonAnnotations.link}}| click here>" title: "{{.CommonAnnotations.summary}}" title_link: "{{.CommonAnnotations.link}}" color: "{{.CommonAnnotations.color}}" -
啟動 docker compose
1docker compose up -d -
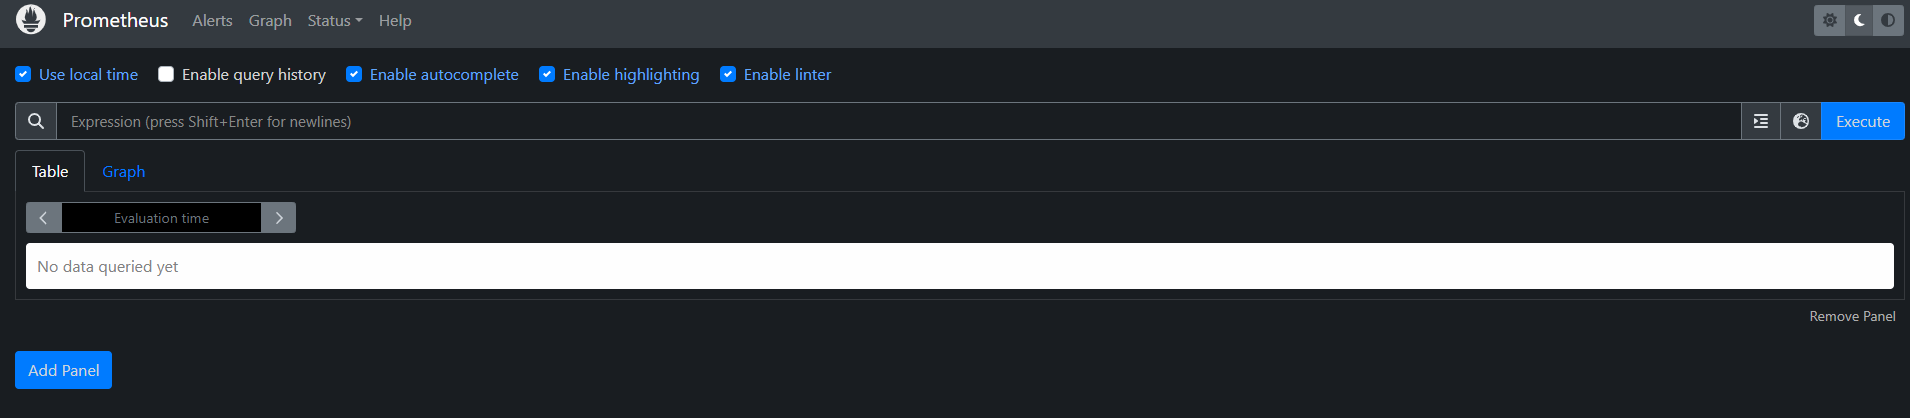
可以於 host_ip:9090 看到 Prometheus UI
-
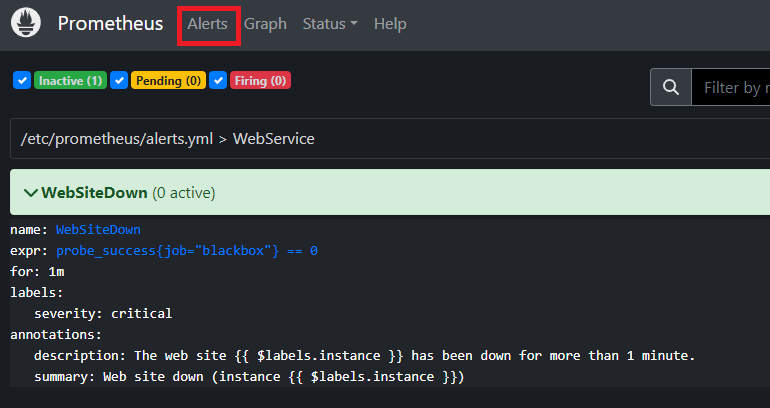
如果 alerts.yml 有正確設定的話,可以於 Alert 分頁看到設定結果
-
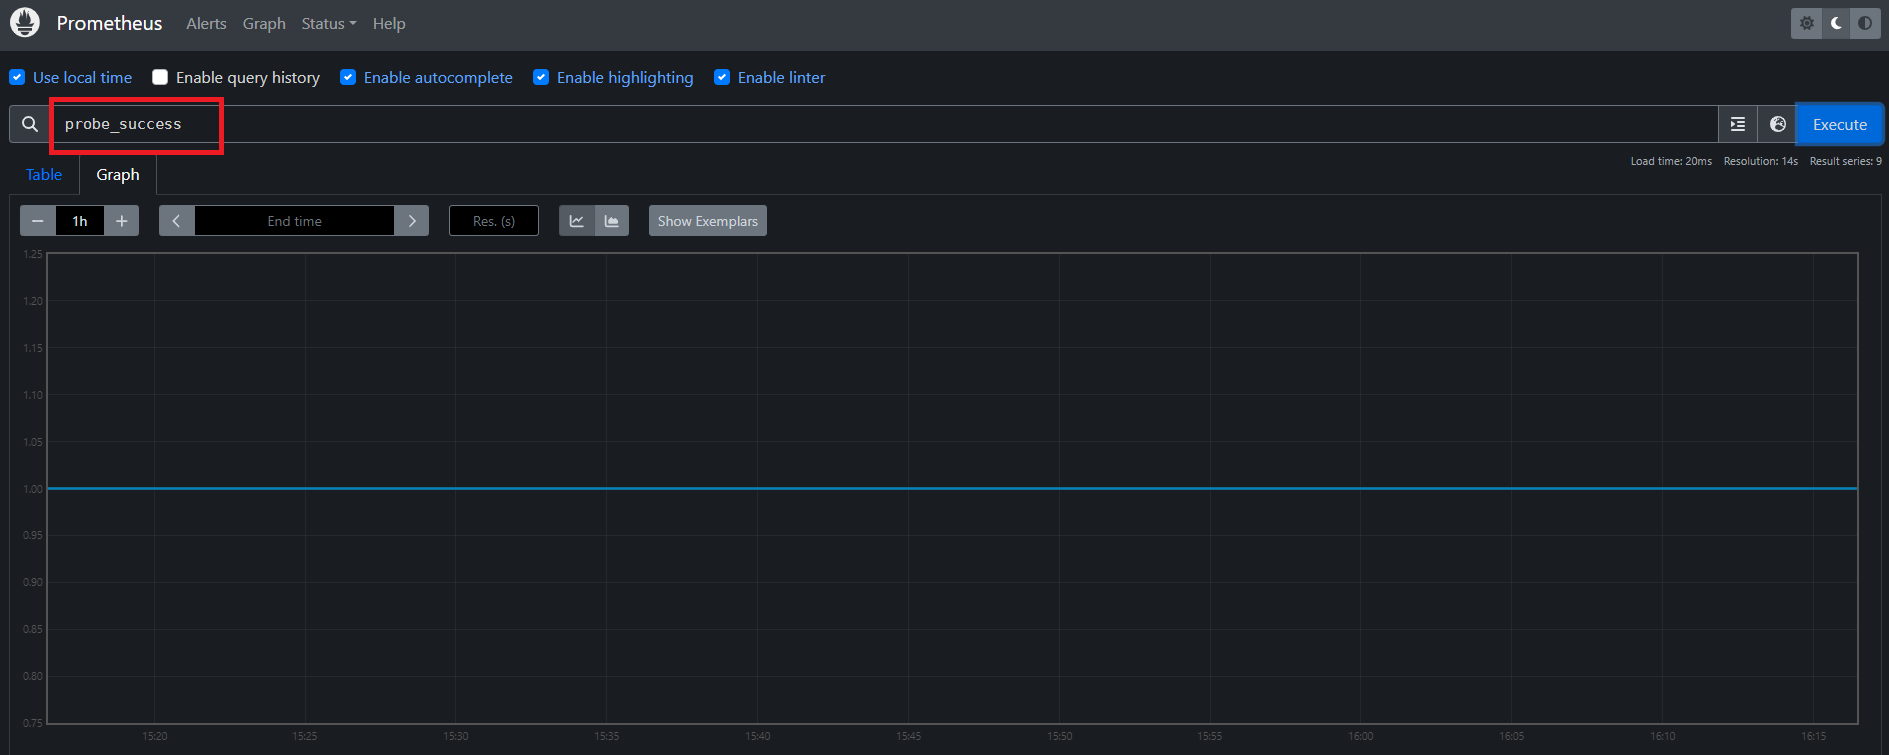
於 Graph 可以透過 PromQL ( Prometheus Query Language ) 查詢結果
-
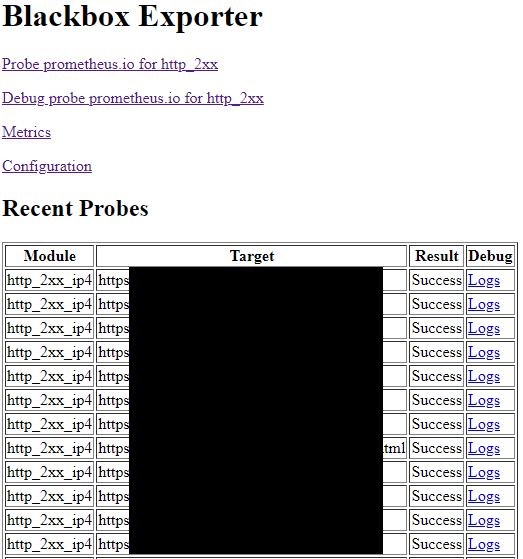
於 host_ip:9115, host_ip:9093 看到 blackbox_exporter, alertmanager 提供的簡單 UI 內容